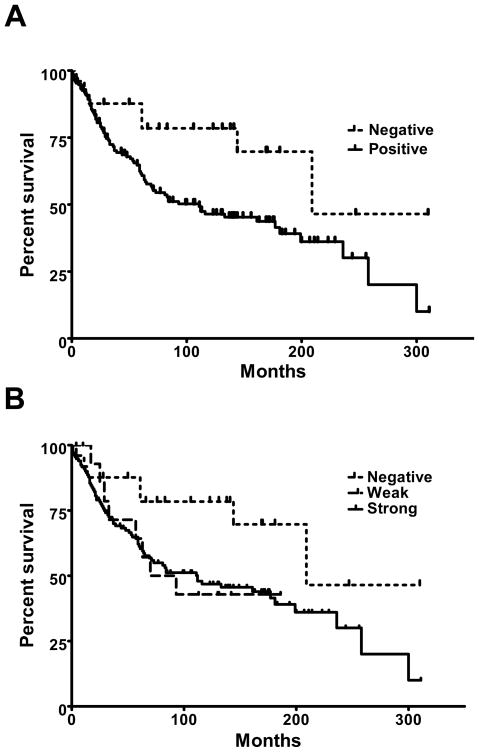
Figure 2. Kaplan Meier plot demonstrating prolonged survival of MT-3 negative breast cancer.
A) The survival distributions between MT-3 positive (solid line) and MT-3 negative (dotted line) breast cancer patients were different by Mantel-Cox Log Rand at a significance of 0.019. B) Kaplan Meier plot of MT-3 staining in breast cancer demonstrates those cancers with weak staining (long dash) had a similar survival to patients with strong staining (solid) line.

