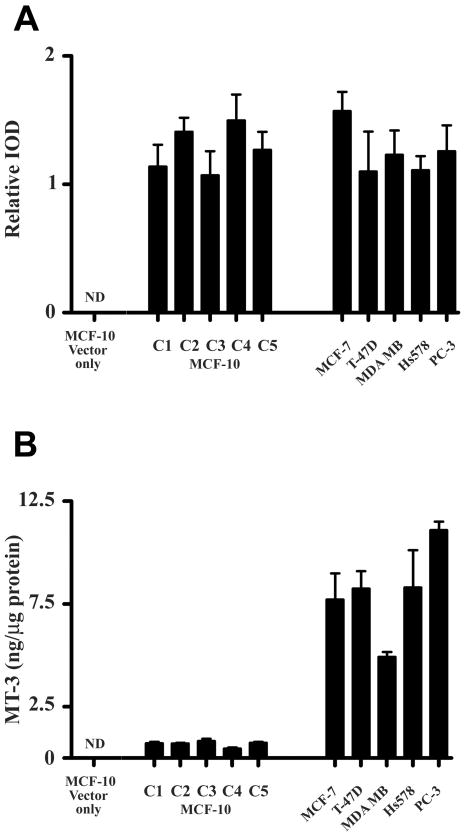
Figure 4. Relative expression of MT-3 in MCF-10A cells compared to breast and prostate cancer cell lines.
Panel (A) shows the relative expression of MT-3 mRNA in the blank vector controls and clones of the MT-3 transfected MCF-10A cells compared to the relative expressions of MT-3 found previously for MT-3 transfected MCF-7, T-47D, MDA-MB-231, Hs578T and PC-3 cell lines (Dutta et al., 2002; Gurel et al., 2003). Relative IODs were calculated from the IOD of product bands obtained at 500 ng total RNA inputs and 30 PCR cycles for each cell line. Panel (B) shows the corresponding expression of MT-3 protein for the above cell lines. All determinations were performed in triplicate. ND indicates a protein level below the limit of detection.

