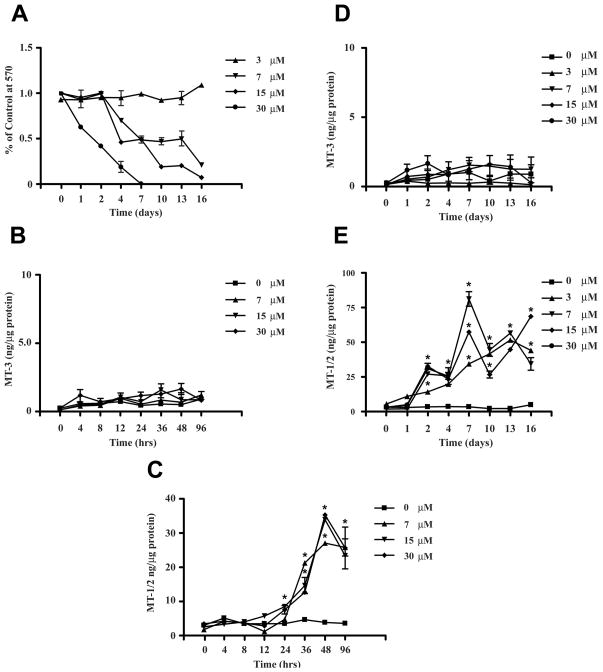
Figure 5. Effect of Cd+2 on MT-3 protein expression in MCF-10A cells stably transfected with MT-3 gene.
Panel (A) shows cell viability when confluent MCF-10A cells stably transfected with the MT-3 coding sequence are exposed to 3 (▲), 7 (▼;), 15 (◆) or 30 (●) μM Cd+2 for 16 days. Cell viability was determined by the MTT assay and all determinations were in triplicate. Values shown are the % of the mean cell numbers at each time point divided by the mean cell numbers of the control cells for each triplicate determination. Panel (B) shows the expression of the MT-3 protein when cells are exposed for 96 hrs to 0 (■), 7 (▲), 15 (▼;) or 30 (◆) μM Cd+2. The determinations were performed in triplicate and the results shown are the mean ± SEM. Panel (C) shows the expression of the MT-1/2 protein when cells are exposed for 96 hrs to 0 (■), 7 (▲), 15 (▼;) or 30 (◆) μM Cd+2. The determinations were performed in triplicate and the results shown are the mean ± SEM. * denote a significant difference from control (p < 0.05). Panel (D) shows the expression of the MT-3 protein when cells are exposed for 16 days to 0 (■), 3 (▲), 7 (▼;), 15 (◆) or 30 (●) μM Cd+2. Panel (E) shows the expression of the MT-1/2 protein when cells are exposed for 16 days to 0 (■), 3 (▲), 7 (▼;), 15 (◆) or 30 (●) μM Cd+2. The determinations were performed in triplicate and the results shown are the mean ± SEM. * denote a significant difference from control (p < 0.05). A single asterisk above overlapping symbols indicates significance for all overlapping points.

