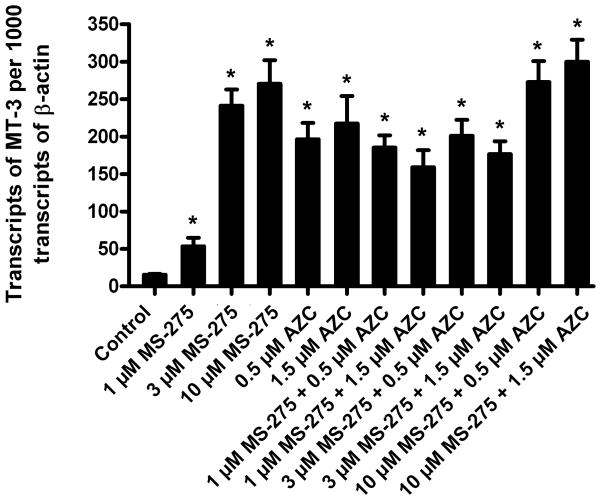
Figure 6. Expression of MT-3 in MCF-10A cells treated with AZC and/or MS-275.
MCF-10A cells were cultured at a 1:10 ratio in the presence of MS-275 and/or AZC until they reached confluency, following which the cells were harvested and the RNA was extracted. Real time PCR analysis was performed to assess the expression level of MT-3 mRNA. The level of MT-3 expression was normalized to that of β-actin. The determinations were performed in triplicate and the results shown are the mean ± SEM. * denote a significant difference from control (p < 0.05).

