
Figure 5.
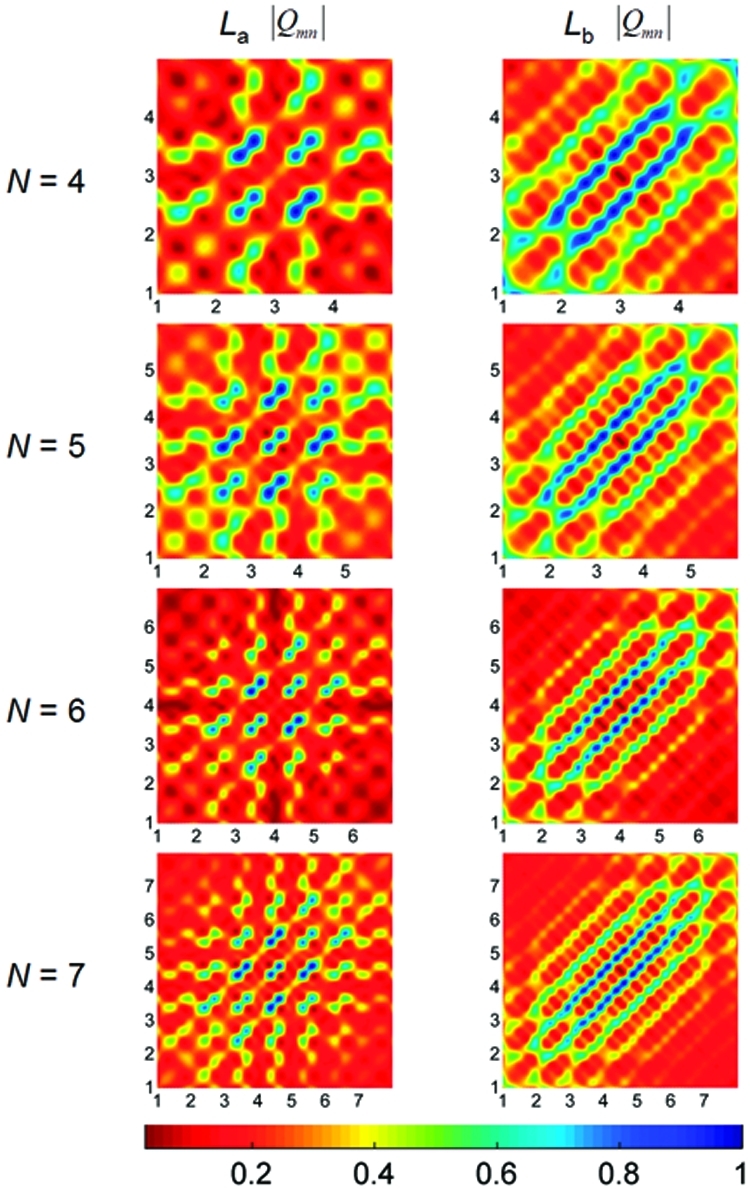
Contour plots of coordinate density matrices (Q) for the La and Lb excited states computed at the LC-BLYP level of theory. The x- and y-axis labels represent the number of benzene repeat units in the molecule. The elements of the coordinate matrix, Qmn, give a measure of exciton delocalization between sites m (x axis) and n (y axis). The color scale is given at the bottom.