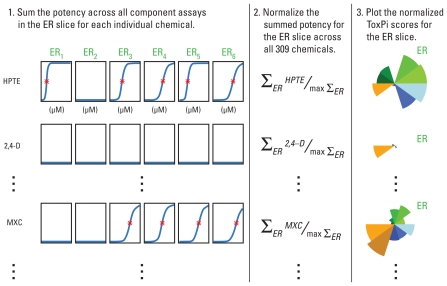
Figure 3.
Translation of results into ToxPi score profiles. The concentration–response curves for each of the six assays in the ER slice are shown for three example chemicals. On each curve, the red asterisk represents the AC50 (potency) for assay “hits,” and flat blue lines indicate assays that are inactive for that chemical. For nonassay slices, the same procedure is followed, with AC50 values replaced by particular chemical property values, pathway scores, and so forth. Abbreviations: 2,4-D, 2,4-dichlorophenoxyacetic acid; max, maximum; MXC, methoxychlor.

