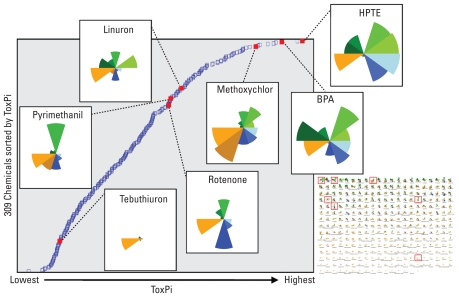
Figure 4.
Distributional dot plot showing reference chemicals along the distribution of sorted ToxPi scores for all 309 ToxCast phase I chemicals. Each blue square indicates the ToxPi for one chemical, sorted according to overall ToxPi; the ToxPi for each reference chemical is indicated by a solid red square. From highest to lowest ToxPi, the reference chemicals are HPTE, BPA, methoxychlor, linuron, pyrimethanil, rotenone, and tebuthiuron. The inset shows the sorted ToxPi profiles for all chemicals (starting with the highest ToxPi in the upper left and proceeding to the lowest in the bottom right), with reference chemicals highlighted by solid red boxes. These profiles have been translated into the distributional dot plot described above.

