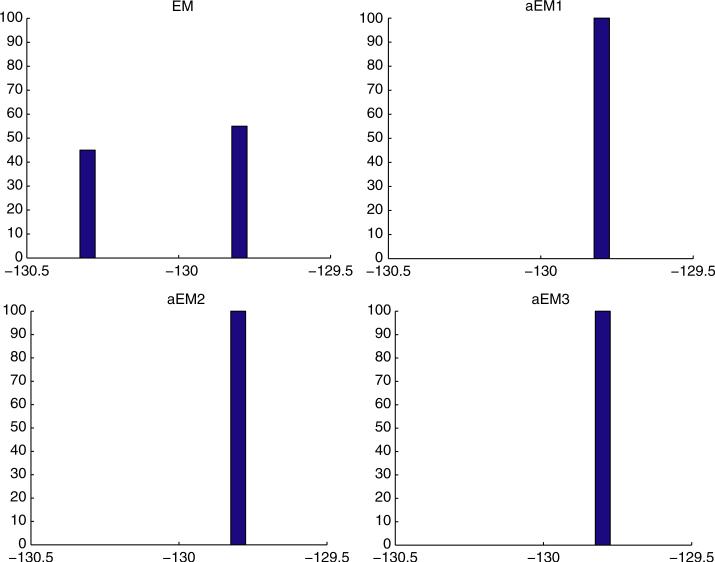
Fig. 2.
Histograms of the converged log-likelihoods found by the EM (top left panel) and aEM algorithms from 100 random starting points for the data in Table 2. For aEM1, ν0 = 100, r = 0.5 and s = 10. For aEM2 and aEM3, ν0 = 0.001, r = 0.5 and s = 10.

