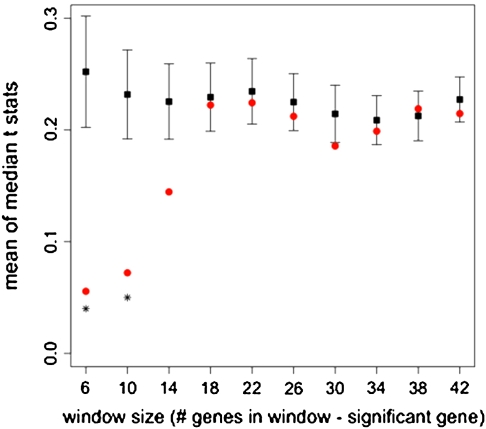
FIG. 3.
Means of the distributions of median t-statistics for a range of window sizes. Black squares refer to windows of randomized gene order and red circles refer to windows around significant genes. Asterisks indicate significant difference (at P = 0.05) of the means generated from the resampling analysis. Note that the randomized median GEI t-statistics span 0.2–0.4, a range of nonzero, positive values that likely result from the observed genome-wide difference between the contrast components (temperate plasticity t-statistic mean ≈ 0.0 and tropical plasticity t-statistic mean ≈ −0.3).

