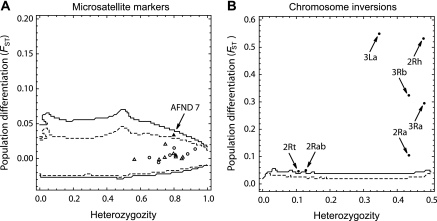
FIG. 2.
Neutrality tests. single-locus FST estimates among geographic populations of A. funestus in Cameroon, plotted against expected heterozygosity (Nei 1987). (A) Data from 16 microsatellites markers located inside (circles) and outside (triangles) common polymorphic chromosomal inversions. (B) Data form seven chromosomal inversion systems. In both panels, outlier loci are pointed by arrows and referred to by their names. Dashed lines and solid lines represent the 95% and 99% confidence limits under the hypothesis of neutrality of the loci, respectively.

