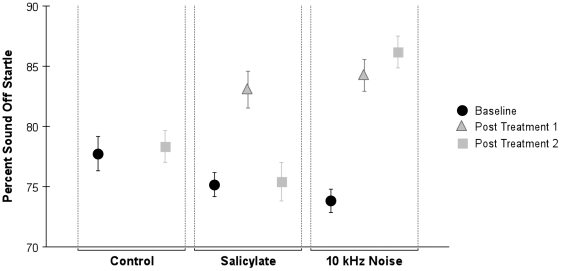
Figure 6. Summary graph of gap ASR comparing experimental groups (control, salicylate, noise) at three different time points (baseline, post treatment 1 and post treatment 2).
For control animals the percent inhibition of startle remains constant. For the salicylate group post treatment 1 testing resulted in decreased inhibition of gASR, but by post treatment 2 testing, gASR had returned to normal levels. The 10 kHz noise group demonstrated a decreased ability to inhibit gASR at both time points following noise exposure when compared to baseline. Error bars equal SEM.

