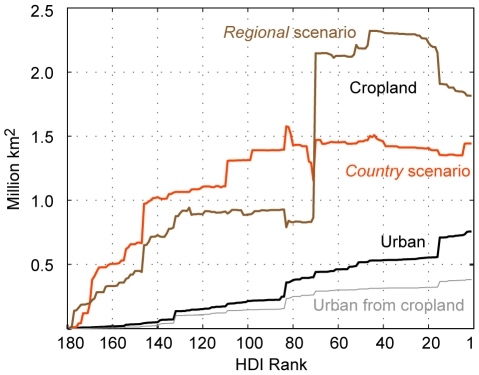
Figure 1. Projected net change in global urban and cropland grid cell area from 2000 to 2015.
Country-level contribution to projected global net change in urban and cropland grid cell area is sorted by 2006 Human Development Index (HDI) rank. There is one projection of urban grid cell area change and two projections of cropland grid cell area change (the country and regional scenarios). The graph also indicates urban grid cell area that was established between 2000 and 2015 on cropland grid cells. The portions of the cropland grid cell area curves that decline indicate countries expected to experience a net decline in cropland grid cell area. This graphic does not include the 0.007 million km2 gain in urban grid cell area in unclassified HDI countries. This graphic does not include the 0.03 and 0.07 million km2 net gain in cropland grid cell area in unclassified HDI countries under the country and regional scenarios, respectively.

