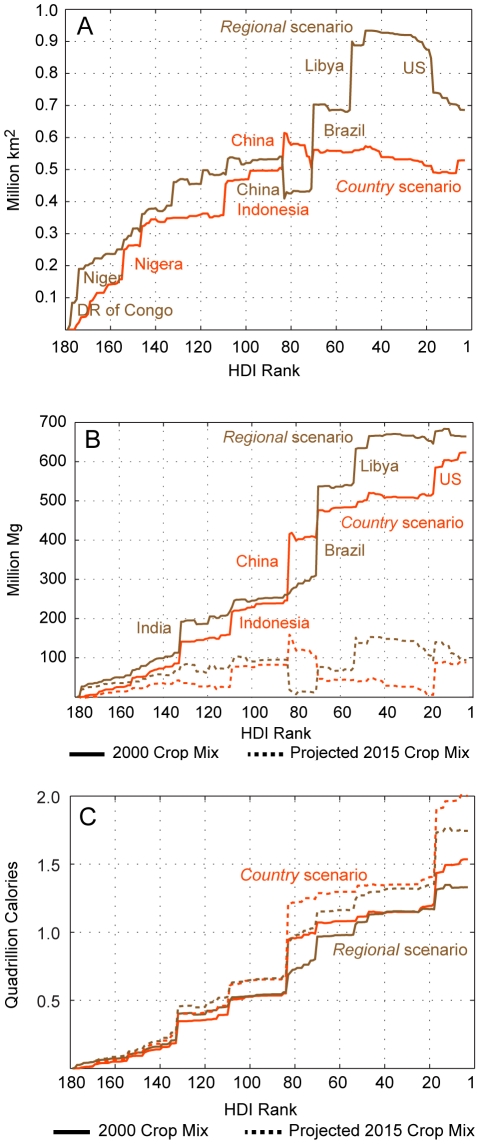
Figure 2. Projected net change in global harvested area and crop production from 2000 to 2015.
Country-level contribution to projected global net change in harvested area (panel A) and crop production measured in mass (panel B) and calories (panel C) is sorted by 2006 HDI rank for both scenarios. Countries projected to experience significant changes are noted. For panels B and C scenario results are given once assuming each country's 2000 crop mix remains as of 2015 (“The 2000 Crop Mix”) and once assuming 2015 crop mixes mimic forecasted trends in crop mix (“Projected 2015 Crop Mix”). By crop mix we mean the relative amount of harvested area devoted to each crop type (e.g., rice, wheat, oil crops, etc.) in a country. Panel C does not include a country's production of crops in the categories fiber crops, oil seeds, and other oil crops. The portions of the curves that decline indicate countries expected to experience a net decline in crop production on the given metric. This graphic does not include the net gain in harvested area and crop production in unclassified HDI countries.

