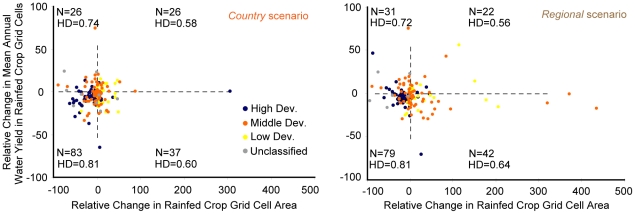
Figure 3. Projected relative change in rainfed cropland grid cell area versus relative change in average annual water yield on rainfed cropland grid cells.
Panel A gives results for the country scenario. Panel B gives results for the regional scenario. Each point represents a country. A high development country (“High Dev.”) has a 2006 HDI greater than or equal to 0.8, a middle development country (“Middle Dev.”) has a 2006 HDI greater than or equal to 0.5 but less than 0.8, a low development country (“Low Dev.”) has a 2006 HDI less then 0.5, and a unclassified country has no HDI score. We indicate the number of countries (N) and the average HDI score (HD) of those countries in each quadrant in each graph.

