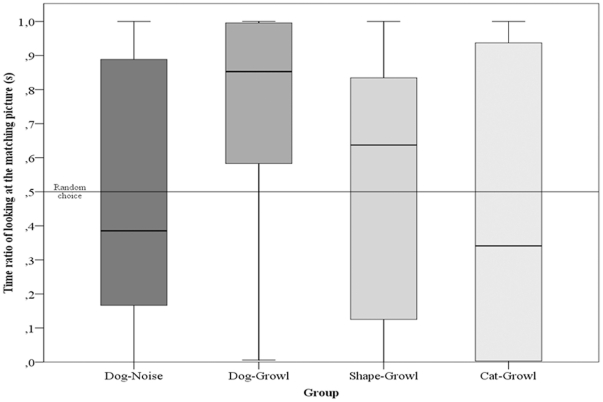
Figure 2. Looking preference towards matching picture.
This graph shows the time ratio of looking at the matching sized picture of dogs in each group. The horizontal line at 0.5 represents random choice when dogs show no preference. The area above the line represents preference towards the matching sized picture. The boxplots shows the median, interquartiles and outliers.

