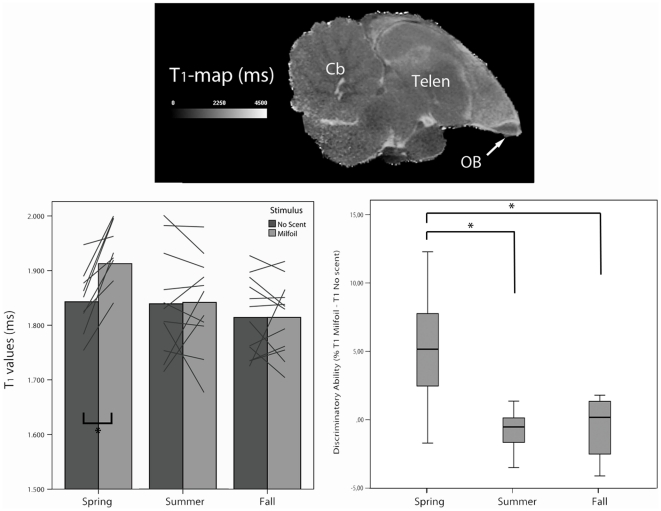
Figure 1. T1 values and ‘discriminatory ability’ of the olfactory bulb (OB) in different seasons.
Top: Sagittal T1-map of one starling stimulated with milfoil during the breeding season. Notice the small size of the olfactory bulb (OB) compared to the rest of the brain and the accumulation of manganese chloride in the bulb resulting in a darker contrast (shorter T1) on T1-maps. Cb = Cerebellum; Telen = Telencephalon. Bottom left: T1 values of the olfactory bulb of the same individuals (N = 14) at different times of the year. In each season each animal was measured twice, once with a milfoil scent as stimulus, once without any scent. Lines represent measurements per starling per season. (*p<0.05). Bottom right: Boxplots of discriminatory ability [100×(T1 milfoil - T1 no scent)/T1 no scent)] of the same individuals (N = 14) at different times of the year. Error bars represent standard deviation. (*p<0.05).

