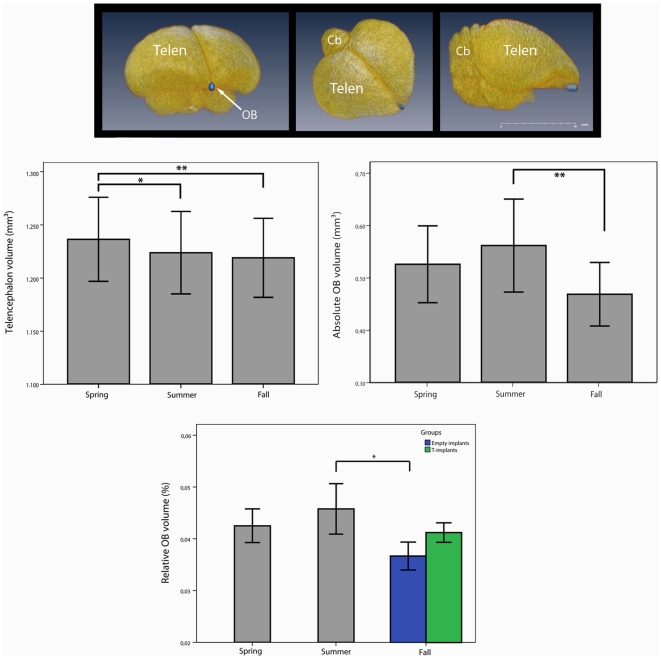
Figure 2. Telencephalon and olfactory bulb volumes.
Top: 3D surface rendering of the starling brain. The olfactory bulb (OB) is indicated in blue. Notice the small size of the OB compared to the rest of the brain. Cb = Cerebellum; Telen = Telencephalon. Middle: Telencephalon volumes (left) and absolute OB volumes (right) of the same individuals (N = 14) at different times of the year. (*p<0.05; **p<0.001). Error bars represent standard deviation. Bottom: Because of the significant seasonal changes in telencephalon volume, the OB volumes are expressed relative to the volume of the telencephalon (in %). Relative OB volumes of the same individuals (N = 14) at different times of the year. After the experiment in summer the starlings were split up into two groups, one received empty implants (N = 9, blue), the other testosterone filled implants (N = 5; green). Error bars represent standard deviation. (*p<0.05).

