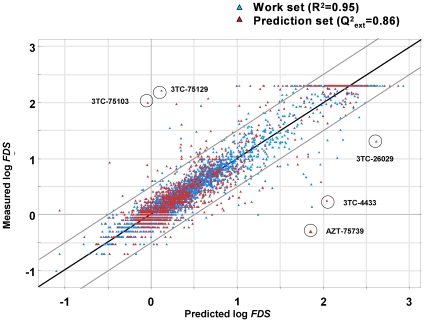
Figure 1. Predictive ability of the HIV RT proteochemometric model.
Illustrated is the external predictive ability of the proteochemometric model (Model-3) for HIV drug susceptibility. The predicted versus measured susceptibility values are shown as red triangles. Goodness-of-fit of the models (i.e. model data) are shown as blue triangles.

