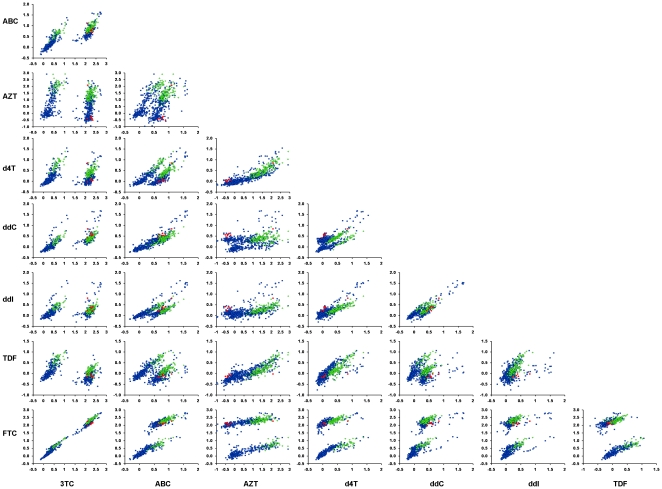
Figure 4. Pair-wise comparisons of NRTI susceptibilities.
Shown are pair-wise comparisons of NRTI susceptibilities for mutant HIV variants, predicted from the proteochemometric model (Model-3). The figure represents the computed susceptibilities for all mutation combinations occurring in the data-set; red symbols represent predictions for the seven RT variants in the data-set that contained the double mutations K65R+M184V; green symbols represent the susceptibilities for 153 variants containing the triple mutations M41L+L210W+T215; the blue symbols represent predictions for 568 other RT variants in the data-set retrieved from the Stanford HIV database.

