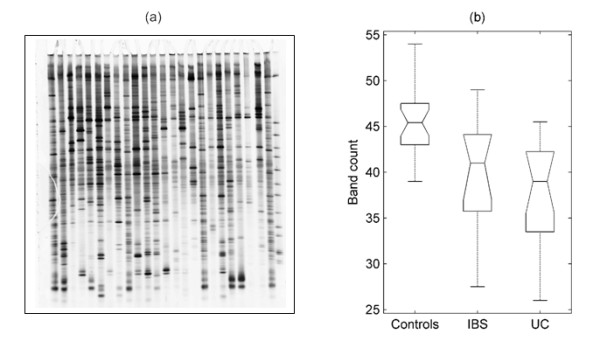
Figure 1.

DGGE profiles and band numbers. (a) DGGE profiles of faecal samples obtained from IBS, UC and control subjects showing the number of bands corresponding to amplicons of the V3 region of 16S rRNA of faecal bacteria. (b) Box plots presenting the median and range of band counts of all faecal samples taken from UC, IBS, and controls. (Boxes have lines at the lower quartile, median, and upper quartile values; whiskers show extent of the rest of the data. Notches display the variability of the median between samples; notches that do not overlap have different medians at the 5% significance level).
