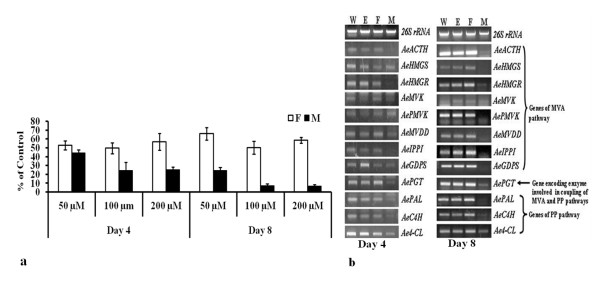
Figure 2.
Effect of inhibitors of mevalonate (MVA) and 2-C-methyl-D-erythritol 4-phosphate (MEP) pathway on (a) shikonins biosynthesis, and (b) gene expression at day 4 and day 8 of the treatment. Mevinolin is an inhibitor of MVA pathway while fosmidomycin inhibits MEP pathway. Different concentrations of mevinolin (M; 50, 100, 200 μM) and fosmidomycin (F; 50,100, 200 μM) were added to the cell suspension culture medium (M9) at day zero (i.e. the day of transfer of culture from growth to production medium). Two controls were also set up, control W had water and control E had ethanol. Concentration of ethanol in E was the same as used for dissolving mevinolin; this was 0.2%, 0.4% and 0.8% in the respective control for 50, 100 and 200 μM of mevinolin. Shikonins content was estimated in cell suspension cultures at day 4 and 8 of the treatment. All the values for shikonins content are shown as mean of three separate experiments with error bar representing standard deviation. Effect of inhibitors [mevinolin (100 μM) and fosmidomycin (100 μM); this was the optimal concentration as evident from experiments in panel a] on gene expression as studied through semi-quantitative RT-PCR at day 4 and day 8 of the treatment. Name of genes is shown on right side of the panel in abbreviated form with their expanded form mentioned in legend of Figure 1. A bar diagram indicating intensities (integrated density value; IDV) of the amplicons of Figure 2b, as measured using Alpha DigiDoc 1000 software, is shown in Additional file 7: Supplementary Figure S5. 26s rRNA was used as an internal control as shown previously [50].

