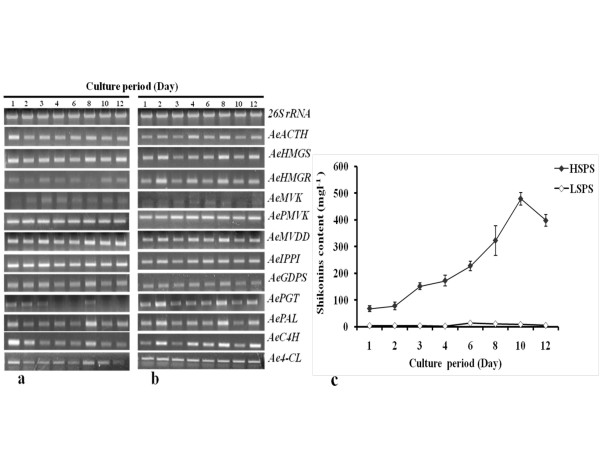
Figure 3.
Expression of various genes in (a) low shikonins producing system (LSPS), and (b) high shikonins producing system (HSPS) vis-à-vis shikonins content (c). Shikonins content was very low in HSPS at day 1 and increased thereafter till day 10, whereas LSPS did not show significant accumulation of shikonins (c). Details on LSPS and HSPS are mentioned in Methods section. All the values for shikonins content are shown as means of three separate experiments with error bar representing standard deviation. Name of genes is shown on right side of the panel in abbreviated form with their expanded form mentioned in legend of Figure 1. A bar diagram indicating intensities (integrated density value; IDV) of the amplicons of Figure 3a and 3b, as measured using Alpha DigiDoc 1000 software, is shown in Additional file 8: Supplementary Figure S6a, b. 26s rRNA was used as an internal control as shown previously [50].

