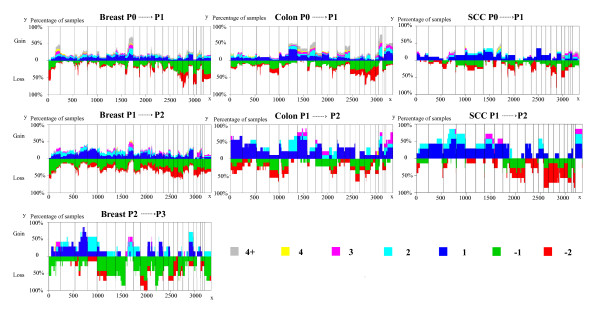
Figure 1.
The development of P0 P1, P1 P2, and P2 P3 subpopulations. The developments of copy number profiles are divided into three groups if available. From top to bottom, the change of P0 P1 subpopulations, P1 P2 subpopulations, and P2 P3 subpopulations for breast (left), colon (center), and SCC (right) tumor samples. The heights of the vertical lines represent the percentage of samples in which the corresponding clones have DNA copy number alterations. The index of clone is given at the bottom and ordered by genomic position (x-axis). The solid vertical bars demarcate the chromosomes. The different copy number alterations were represented by colors in the lower right corner.

