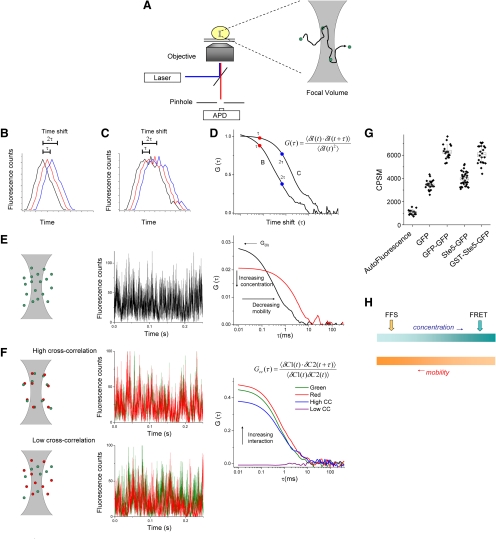
Figure 1.
Basis principles of single point FFS. (A) A high numerical aperture objective focuses a laser source to a diffraction limited focal volume. Fluorescence is collected through the same objective and passes through a pinhole before collection with an avalanche photodiode (APD). Inset depicts a single fluorescent molecule diffusing through the focal volume. (B and C) Theoretical fluorescence trace from a single molecule diffusing rapidly (B) or slowly (C). The data (black curve in each panel) is computationally shifted in time by spacing τ, 2τ (red and blue curves, respectively), and similarity, or correlation, is calculated (see the text for more detail). (D) Resultant correlation curves for traces in B and C, using the equation shown. G(τ) represents the amplitude of the correlation as a function of τ. The expected shift of the curve for the slow molecule toward the right compared with that for the fast molecule is shown. (E) Focal volume, a simulated fluorescence trace, and resultant correlation curve from single-color FCS measurement. The initial amplitude of the correlation curve (G0) is inversely proportional to concentration, and the decay of the curve with respect to τ is indicative of the average diffusion rate of the molecules. Two curves are shown, depicting different concentrations and different mobility. (F) Principle of cross-correlation spectroscopy. Two spectrally distinct probes are used. In addition to the autocorrelation analysis of the individual channels, the two channels are cross-correlated. The top row represents a strongly interacting pair, and is labeled high cross correlation. Note the similarity of the fluctuations in the two channels. The bottom row represents a noninteracting pair. The amplitude of the resultant cross-correlation curve is proportional to the strength of the interaction, as indicated by the arrow in the right panel. (G) In PCH, molecular brightness in counts per second per molecule (CPSM) are determined, and can be compared with controls, such as monomeric GFP and dimeric GFP (GFP–GFP) to determine the stoichiometry of the diffusing complex. Shown are examples of mostly monomeric Ste5-GFP and dimeric GST-Ste5-GFP (Slaughter et al., 2007). (H) FFS is ideally suited for mobile components present at low concentration, whereas FRET and other imaging methods are most successful at high concentration and low complex mobility.

