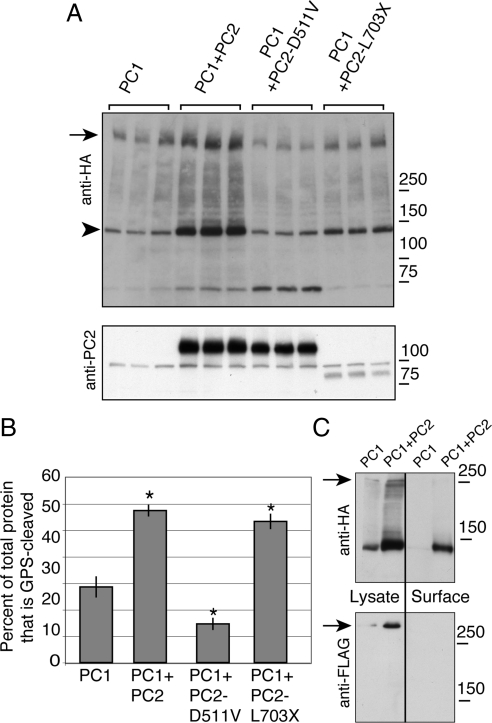
Figure 2.
Cleavage of PC1 at the GPS is correlated with PC2-induced surface localization. Lysates from cells expressing PC1 alone or cotransfected with PC2, PC2-D511V, or PC2-L703X were immunoblotted with an antibody directed against the C-terminal HA tag of PC1, revealing the full-length PC1 band (arrow) and the large fragment resulting from cleavage at the GPS site (arrowhead, A). Expression of PC2 was verified using anti-PC2 antibody (A, bottom). The proportion of GPS-cleaved PC1 was calculated as the intensity of the GPS-cleaved protein band divided by the quantity of total PC1 protein expression, which was itself determined by summing the densities of the three major bands visible by Western blot: full-length, 150-kDa, and 70-kDa bands (B). Western blotting revealed that the 70-kDa band is not detected in untransfected cells (data not shown). Asterisk indicates significant increase or decrease in comparison to PC1 expressed alone (p < 0.05), and error bars indicate SE. Comparing the lysate and the surface protein in HEK cells expressing PC1 and PC2, as detected using surface biotinylation and streptavidin pull-down (lanes labeled Surface), showed that most of the surface PC1 had been GPS-cleaved (C, top). There was no full-length PC1 detected in the biotinylated fraction (arrow, C). Blotting with an anti-FLAG antibody showed that FLAG-positive full-length PC1 protein was not present in the pool of surface PC1 (C, bottom).

