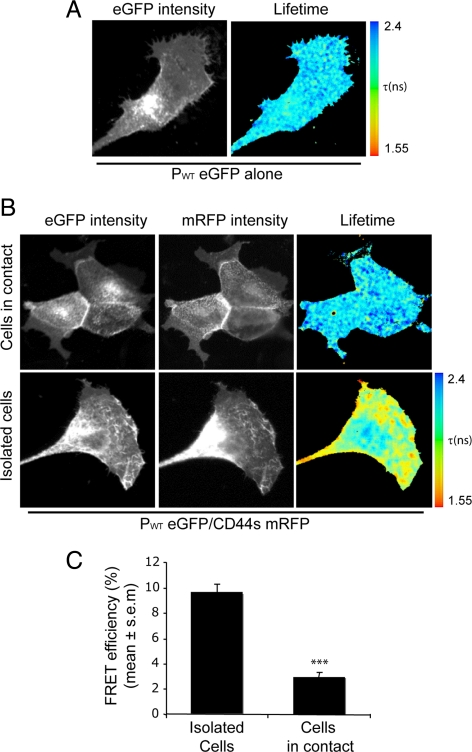
Figure 4.
Podoplanin–CD44s complexes at the plasma membrane are up-regulated in cells with a migratory phenotype. (A–C) Multiphoton FLIM was used to image FRET between PWT eGFP (donor) and CD44s-mRFP (acceptor) in MDCK cells. The images show the eGFP multiphoton intensity image and (where appropriate) the corresponding wide-field CCD camera image of mRFP expression. Lifetime images mapping spatial FRET across the cells are depicted using a pseudocolor scale (blue, normal eGFP lifetime; red, FRET). (A) Control MDCK cells expressing PWT eGFP alone demonstrated a normal GFP lifetime (τ in ns) in the absence of acceptor. (B) Cells coexpressing PWT eGFP and CD44s-mRFP display a localized shortening of the eGFP fluorescence lifetime, which is demonstrated by red in the pseudocolor scale. Note that although colocalization between PWT eGFP and CD44s–mRFP was always detected, FRET was recorded mainly in isolated cells (i.e., those that had detached from their neighbors). (C) Bar graph representing average FRET efficiency of 14 cells for each condition over three independent experiments. The Student's t test was used to evaluate statistical significance between different populations of data. ***p < 0.0005.

