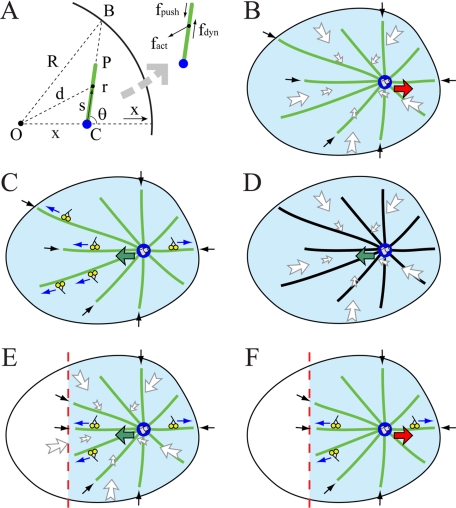
Figure 2.
Geometry of the force generation. (A) Three principal forces on a single MT (green line) of length r in the cell with radius R: length-dependent force fdyn by outward-pulling dyneins, flow- and length-dependent force fact generated by the centripetal actin drag, and inward pushing force fpush. CS (blue) is displaced from the cell center by x. O, C, P, B, d, s, and θ are the geometric variables characterizing MT position and orientation used for force calculations in the Supplemental Material. (B) Perturbation (i): When dynein is inhibited and only actin drag and dynamic MT forces are present, centering is destabilized and the CS moves away from the center. (C) Perturbation (ii): When myosin is inhibited, the actin flow stops and only dynein and dynamic MT forces are present; the CS is stabilized at the center. (D) Perturbation (iv): When both dynein is inhibited and MTs are stabilized by Taxol, the actin flow stabilizes the CS at the center. (E) Perturbation (v): After the local application of nocodazole (modeled by eliminating MTs from the wedge of the cell), the CS shifts toward this wedge. (F) Perturbation (vi): After the local application of nocodazole and inhibition of myosin, the CS shifts away from the wedge. Green arrows, the CS is stabilized and moves toward the center; red arrows, the CS is destabilized and moves away from the center; blue arrows, pulling dynein forces; white arrows, actin–myosin drag forces; and black arrows, decentering forces associated with dynamic MTs. Dynamic MTs are shown in green, and Taxol-treated stable MTs are shown in black.

