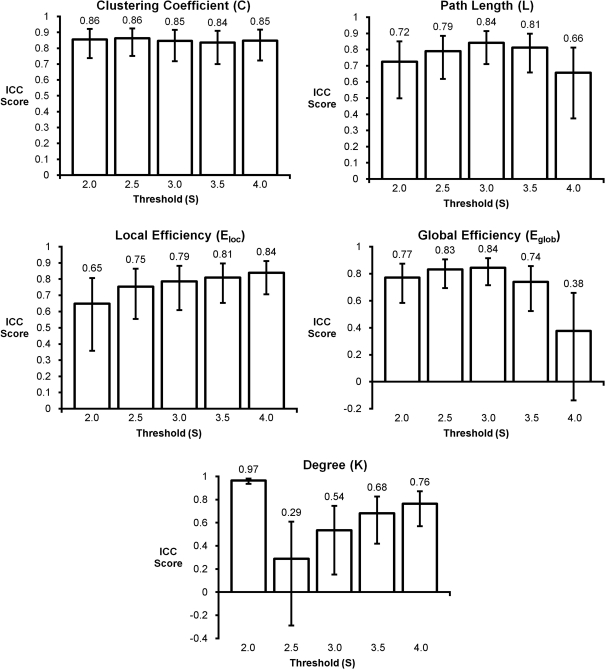
Figure 4.
Intraclass correlation coefficient plots for graph metrics across different thresholds. Clustering coefficient had the most consistent reproducibility across thresholds, while degree appears to change the most as the threshold changes. Reproducibility across thresholds S = 2.5–3.5 appears to be consistent for most graph metrics.

