
Figure 4. Quantitative comparison of the tracer coupling pattern of OFF α-GCs seen in dark- and light-adapted retinas.
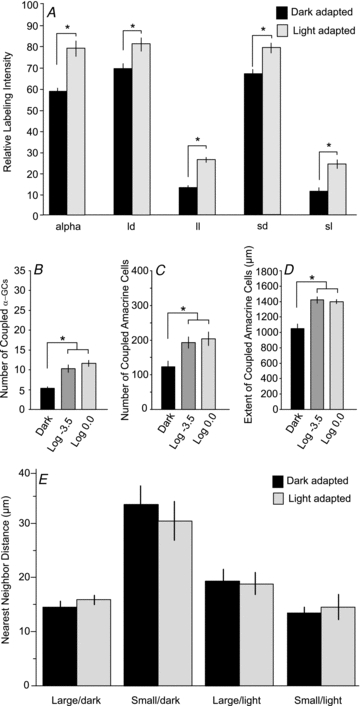
A, bar graph comparing the relative labelling intensity of the coupled α-GCs and four subtypes of amacrine cells in dark- and light-adapted retinas. Columns show means and standard error bars. The data for light-adapted retinas included retinas exposed to mesopic (log −3.5) and photopic (log 0.0) background lights. The labelling intensity for each was statistically different (asterisks, P < 0.01) in dark- and light-adapted retinas. B, bar graph showing the difference in the number of coupled α-GCs in dark- and light-adapted retinas. There was a statistically significant difference (asterisk, P < 0.01) in the number of coupled α-GCs in dark- and light-adapted (log −3.5 and log 0.0) retinas. There was no statistical difference in the number of α-GCs in retinas adapted with log −3.5 or log 0.0 background lights. C, bar graph showing the difference in the number of coupled amacrine cells in dark- and light-adapted retinas. There was a statistically significant difference (asterisk, P < 0.01) in the number of coupled amacrine cells in dark- and light-adapted (log −3.5 and log 0.0) retinas. There was no statistical difference in the number of amacrine cells in retinas adapted with log −3.5 or log 0.0 background lights. D, bar graph showing the maximum distance of coupled amacrine cell somata from the injected OFF α-GC in dark- and light-adapted retinas. There was a statistically significant difference (asterisk, P < 0.01) in the extent measured in dark- and light-adapted (log −3.5 and log 0.0) retinas. There was no statistical difference in the extent measured in retinas adapted with log −3.5 or log 0.0. E, bar graph comparing the nearest neighbour distances for the four subtypes of amacrine cells coupled to OFF α-GCs in dark- and light-adapted (log −3.5 and log 0.0) retinas. There were no statistically significant differences (P > 0.1) seen under the different adaptation states.