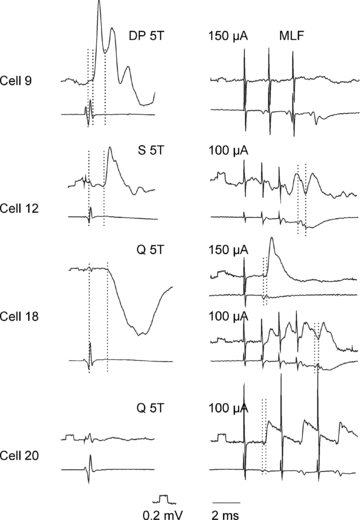
Figure 1. Examples of PSPs used to identify the 20 interneurons analysed morphologically.

In each panel, the upper trace is an intracellular record from the cell indicated (with negativity downward) and the lower trace is from the cord dorsum (with negativity upward). The stimuli were applied to the deep peroneal (DP), sartorius (S) and quadriceps (Q) nerves. The intensity of the stimuli is expressed in multiples of the threshold (T) for the most sensitive afferents in a given nerve. Stimuli applied to the medial longitudinal fasciculus (MLF) were at intensity of 100 or 150 μA. In the left panels the first dotted lines indicate the afferent volleys while the second and the third dotted lines indicate the onset of PSPs evoked by these afferents; monosynaptic EPSPs from group I and II afferents (as defined by both their threshold and segmental latency) in cell 9, monosynaptic EPSPs from group II afferents in cell 12 and disynaptic IPSPs from group II afferents in cell 18. In right panels the first dotted lines indicate the descending volleys from the MLF and the second dotted lines indcate the onset of disynaptic IPSPs evoked by these volleys in cell 12 and of monosynaptic EPSPs evoked in cells 18 and 20. Calibration pulses at the beginning of all microelectrode records are 0.2 mV, time calibration: 2 ms. The records illustrate monosynaptic EPSPs from group I and II afferents and lack of synaptic actions from the MLF in cell 9, and monosynaptic EPSPs from the MLF evoked in parallel with disynaptic IPSPs from group II afferents in cell 18 or without PSPs from the dissected muscle nerves in cell 20.
