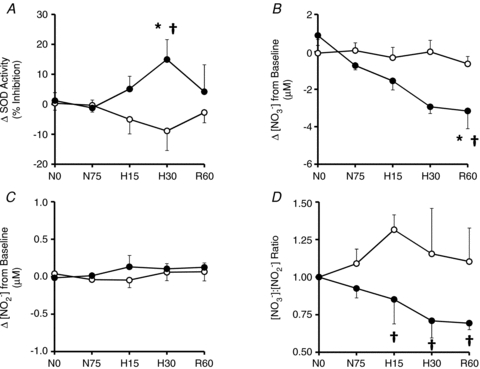
Figure 3. Fetal plasma SOD activity and plasma concentrations of NO2− and NO3−.

Values are means ±s.e.m. for changes from baseline in fetal plasma SOD activity (A), plasma concentrations of NO3− and NO2− (B and C, respectively) and the plasma concentration ratio of [NO3−]:[NO2−] (D) at 0 (N0) and 75 min (N75) of normoxia, at 15 (H15) and 30 min (H30) of hypoxaemia and 60 min (R60) of recovery for fetuses exposed to 0.5 h of hypoxaemia during saline infusion (○, n = 6) or treatment with vitamin C (•, n = 6). Significant differences are *P < 0.05 vs. normoxia, †P < 0.05 vs. saline (two-way RM ANOVA with Tukey's post hoc test).
