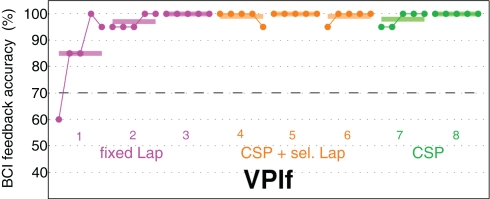
Figure 2.
The graph shows the feedback performance of one BCI-naive subject from the very first trial on. Results are from one single session in which 8 runs of 100 trials (about 15 min) each have been recorded. There was no calibration period before. Feedback started with a general, subject-independent classifier which was adapted trial-by-trial. Dots indicate the average feedback performance (1D cursor control) of 20 trials. The mean performances of each run of 100 trials is shown as bars. The three colors relate to three different processing methods, which are explained in Section 2.4.

