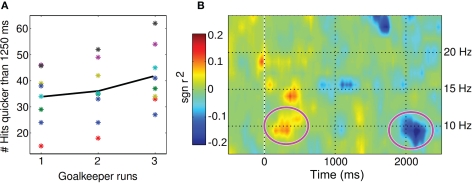
Figure 4.
(A) Brain–computer interfacing reaction times are shown for all participants (asterisk) and grand average (solid line) separately for all three runs which had increasing time pressure to enforce faster BCI decision. As “BCI reaction time” we denote the latency from cue presentation until the decision of the user as conveyed by the BCI system. (B) The time-frequency plot displays the contrast (r2 difference) between run 3 and run 1.

