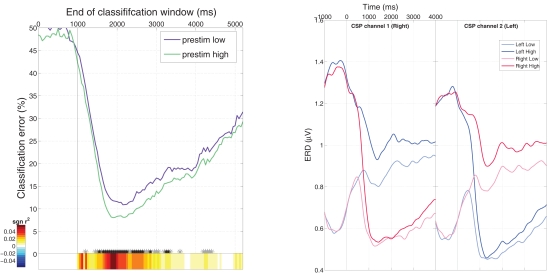
Figure 5.
Left: Classification error for two groups of feedback trials with high and low prestimulus SMR amplitude. Classification was performed on a 1000 ms sliding window with 50 ms overlap and significant differences are denoted by “*” (black: p < 0. 01, gray p < 0.05). Right: ERD for the different groups of the two classes (high and low for left and right).

