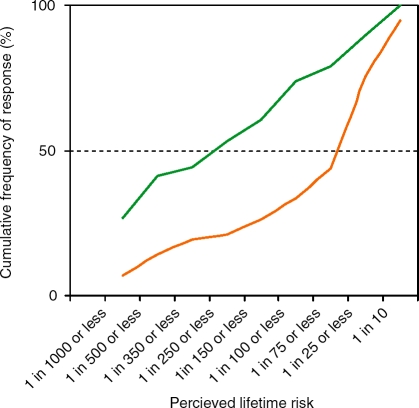
Figure 3.
Cumulative risk of CRC. Nonparticipants (green line) perceived higher lifetime risk than participants (orange line) at all ranges of risk, indicating that the high rates of risk perception in some nonparticipants were not offset by lower rates of risk perception in others. This difference was statistically significant (χ2 = 30.02, p <.001).

