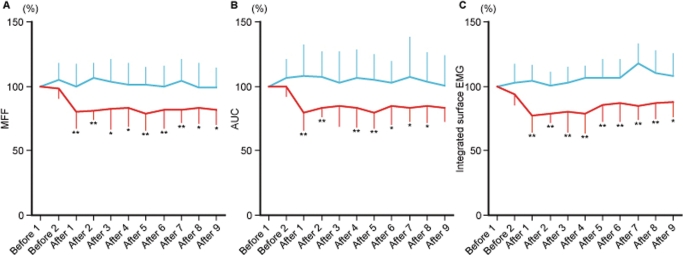
Figure 3.
Changes in mean (SD) (A) maximum finger flexion force (MFF), (B) area under the curve (AUC) of finger flexion force (C) and integrated surface EMG for 16 subjects in the acupuncture condition (red line) and control condition (blue line). Vertical axis is the percentage of before 1 value of MFF, AUC and integrated surface EMG and the horizontal axis is time. *p <0.05, **p < 0.01.

