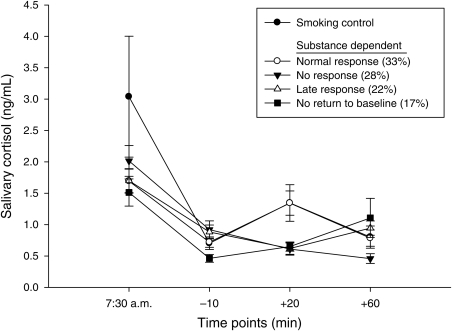
Fig. 5.
Salivary cortisol levels in substance-dependent individuals and smoking controls following profile analysis. Following group profiling, results indicated that the four salivary cortisol response patterns identified were statistically distinct (P < 0.0001). Substance-dependent individuals in the ‘normal’ response group (33% of the sample) did not differ from smoking controls at any time point (P > 0.96). Further, those in the ‘normal’ response group differed from all other groups at the +20 min time point (P = 0.0005).

