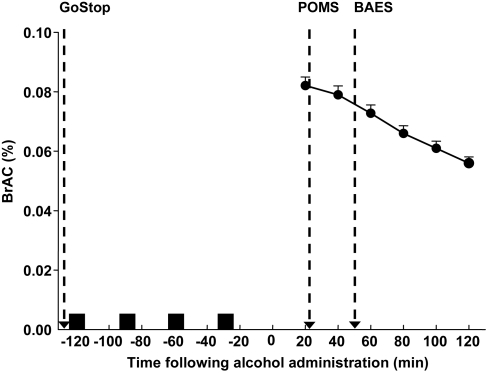
Fig. 1.
Timeline of drink administration in relation to the measurements of impulsivity and subjective effects. Also shown is the mean (± SEM) BrAC curve following 0.8-g/kg 95% alcohol administered in a binge-like fashion (four drinks over 2 h). Arrows indicate times the GoStop Impulsivity Paradigm, the POMS and the BAES were completed by the participants. Black squares indicate times of alcohol drink administration.

