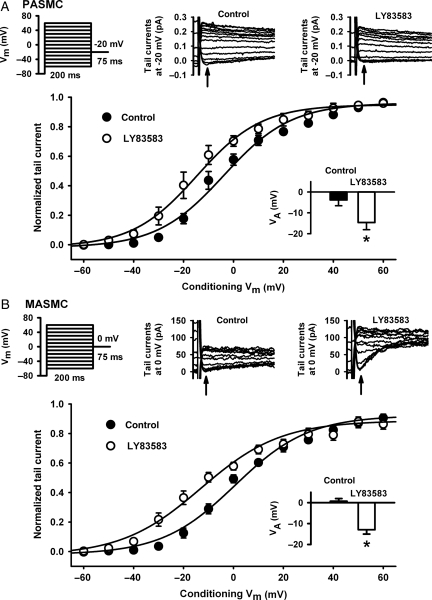
Figure 6.
Effects of LY83583 on steady-state activation of voltage-gated K+ currents. Voltage protocols: cells serially subjected to a range of preconditioning pulses between −60 and +60 mV, each followed by a short test pulse to −20 mV (A, PASMC) or 0 mV (B, MASMC). Representative traces: tail currents evoked at relevant test potential before (control) and during application of LY83583 (10 μmol/L for 10 min). Note: different test potentials were chosen for ease of measurement of much smaller currents in MASMC. Arrows indicate point at which measurements were taken. Main summary plots: Tail current measurements from PASMC (A, n = 5) and MASMC (B, n = 6), normalized to maximum current amplitude, plotted against conditioning potential and fitted by Boltzmann non-linear regression. Inset bar-charts: VA calculated from Boltzmann fit in PASMC (A, *P < 0.01 vs. control) and MASMC (B, *P < 0.01 vs. control). Note: all currents recorded in the presence of 1 μmol/L paxilline and 10 μmol/L glibenclamide to block BKCa and KATP channels.

