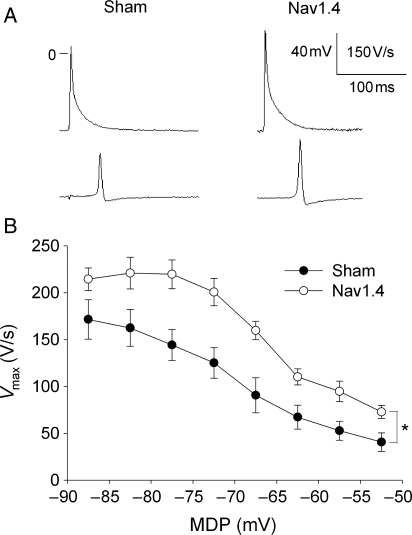
Figure 3.
(A) Representative AP recorded from the RV free wall of one Sham and one Nav1.4-expressing mouse in Tyrode’ solution containing 4 mmol/L KCl. Note that AP in Nav1.4 mouse has higher amplitude and Vmax. (B) Dependence of Vmax on MDP. Values were collected from multisite microelectrode mapping at 4 and 10 mmol/L KCl. In each preparation, Vmax values were grouped and averaged for each 5 mV step along the abscissa. Each individual experiment was allowed to contribute one point in each step. *P < 0.05 (n = 9 for each group).

