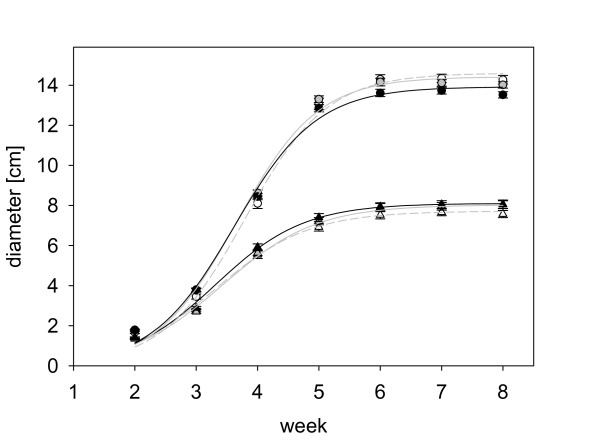
Figure 4.
The growth of EBF emitting and wild type plants over time under different fertilizer regimes. Triangles represent low fertilizer conditions, circles high fertilizer conditions. Empty symbols stand for wild type plants (Col-0), grey symbols for FS11 plants, and black symbols for FS9 plants. Lines represent the logistic growth functions for the different treatments (diameter = a/(1 + exp (b - c * week))). Parameters: low fertilizer conditions: wild type plants: a = 7.72, b = 4.39, c = 1.32; FS11 plants: a = 8.03, b = 4.47, c = 1.31; FS9 plants: a = 8.10, b = 4.61, c = 1.39; high fertilizer conditions: wild type plants: a = 14.61, b = 5.67, c = 1.50; FS11 plants: a = 14.42, b = 5.57, c = 1.52; FS9 plants: a = 13.92, b = 5.39, c = 1.49.

