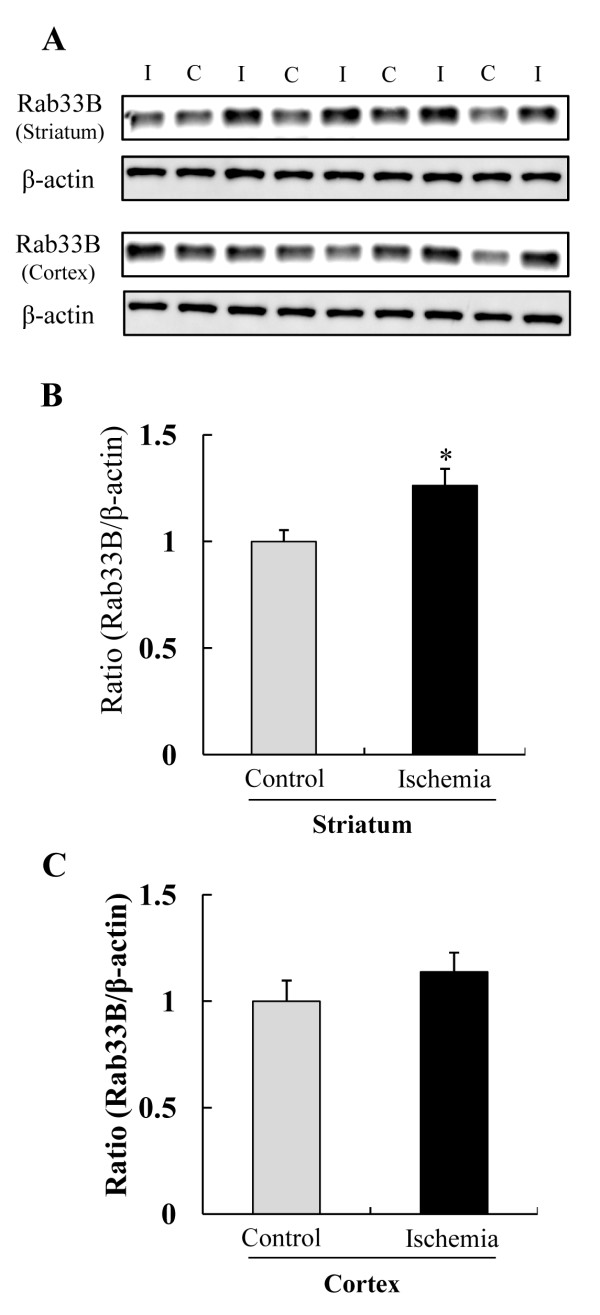
Figure 3.
Western blot analysis of Rab33B in ischemic area at 8 h after 2 h ischemia -reperfusion. (A) Representative band image showed Rab33B expression of ischemia (I) group and control (C) group. (B) and (C) Rab33B expressions were quantified by densitometry and corrected by reference to β-actin. (* P < 0.05, t-test) Data are shown as mean ± S.E.M. (n = 4 or 5).

