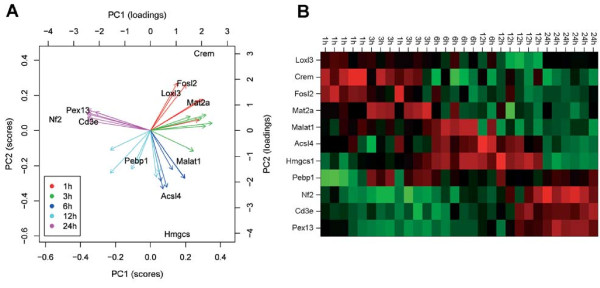
Figure 2.
Results of PCA analysis. (A) Biplot of 11 candidate genes (scores) and time points after CRH treatment (loadings). The first two principal components (PC1 and PC2) were used to generate the biplot. In particular, correlations between the gene data points Pex13, Cd3e and Nf2 on the one hand as well as Crem and Fosl2 on the other hand are conspicuous. (B) The heat map represents the grouping of genes and time points by PCA. 24 h-replicates are completely separated whereas 1 h-and 3 h-replicates as well as 6 h-and 12 h replicates differentiate only partly based on the expression data. Positive and negative values of log2 expression ratios are colored in red and green, respectively. Black colored expression ratios illustrate no differential expression.

