
Fig. 5.
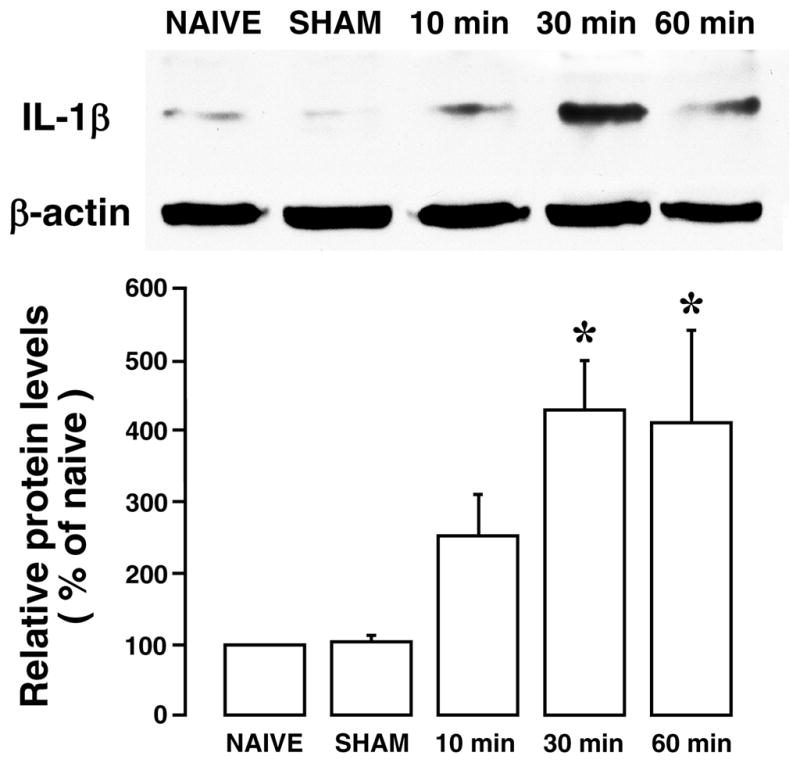
Western blot illustrating the effect of ES of the masseter nerve on IL-1β expression in the ventral Vi/Vc transition zone. β-actin was used as a loading control. A representative blot is shown on top. The relative protein levels are shown in the bottom histogram. *, p<0.05 vs. NAIVE. N=3–4 for each time point. Error bars represent S.E.M.