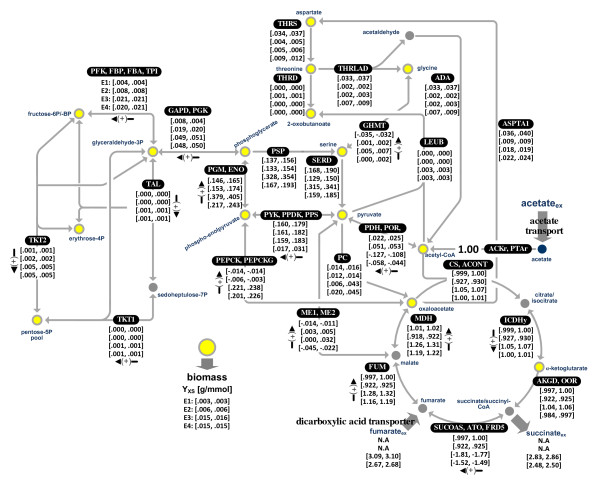
Figure 2.
In vivo flux estimates (95% confidence intervals given for the flux mean estimates) for the central metabolic network of G. sulfurreducens, corresponding to E1, E2, E3, and E4 (Table 1). All fluxes are normalized to acetate uptake (ACKr, PTAr). Gray double-headed arrows indicate bidirectional reactions, and the black arrowa with plus signs correspond to the net direction of a positive value for the bidirectional reactions. Unidirectional reactions were indicated by gray single-headed arrows. The subscript "ex" denotes extracellular metabolites. The abbreviations (pathway enzymes) are listed in Table 2, and precursor demand for biomass synthesis (precursors in yellow color) in Table 4.

