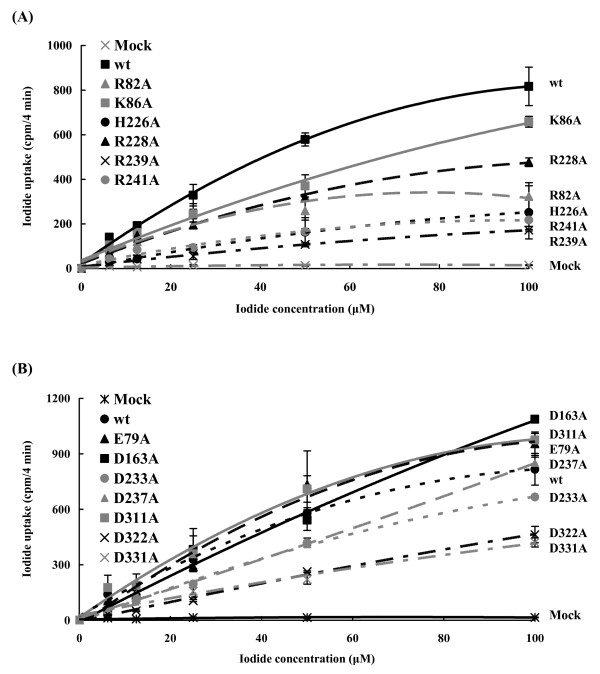
Figure 4.
Kinetic analysis of NIS mutants. HepG2 cells were transfected with pcDNA3.1 (mock), wild-type (wt), or mutated NIS DNAs. After 24 h, initial rates (4 min time points) of iodide uptake were determined at the indicated concentrations of iodide. Calculated curves were generated using the equation v = (Vmax × [I])/(Km + [I]) + 0.0156 × [I] + 2.4588. The terms 0.0156 × [I] + 2.4588 correspond to background adjusted by least squares to the data obtained with non-transfected cells. Values are mean ± standard error of triplicate assays.

