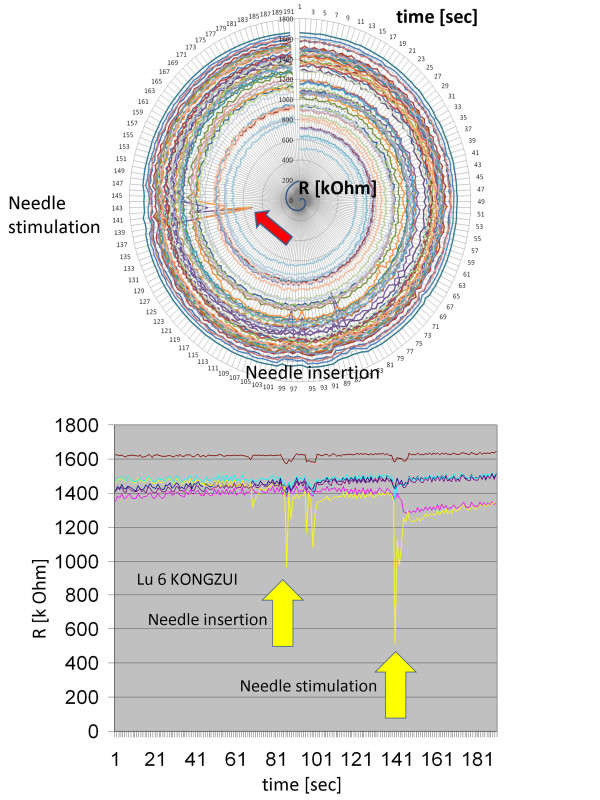
Figure 3.
Analyses of the 48 channels of the impedance system during needle insertion and needle stimulation. Top: Circular chart - needle stimulation (time in sec clockwise and resistance R in kOhm from center outwards). Bottom: Changes in electrodermal impedance during manual needle stimulation (note the lowered impedance in some, but not all channels). Six channels surrounding the acupoint were randomly chosen. In this measurement, the most marked change in impedance during insertion and stimulation of the metal needle can be found in one electrode (yellow line) next (2.5 mm) to the acupoint.

