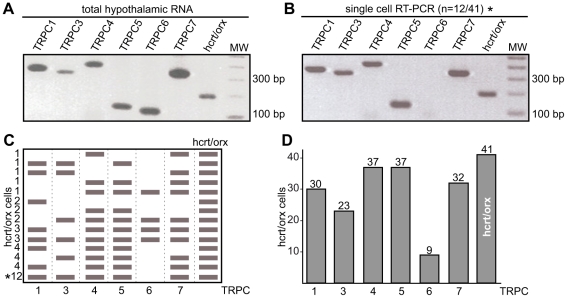
Figure 2. Single-cell RT-PCR of TRPCs in hcrt/orx neurons.
(A) RT-PCR experiment on 500 pg total RNAs isolated from the hypothalamus. Agarose gel electrophoresis showing that mRNAs encoding the TRPC1, 3, 4, 5, 6, and 7 are all detected and generate PCR fragments with sizes of respectively 363, 333, 402, 129, 114 and 337 bp. The hcrt/orx PCR fragment size is 189 bp. MW: molecular weight (100 bp DNA ladder). (B) Single-cell RT-PCR experiment. Agarose gel electrophoresis illustrating the more frequently observed TRPC expression pattern, found in 12 out of 41 hcrt/orx cells. It corresponds to TRPC1, 3, 4, 5 and 7. MW: molecular weight (100 bp DNA ladder). (C) Different TRPC expression patterns identified in the 41 hcrt/orx cells investigated. The asterisk indicates the more frequently observed pattern also illustrated in panel B. (D) Histogram showing the occurrence of the different TRPC subunits in the 41 investigated cells.

