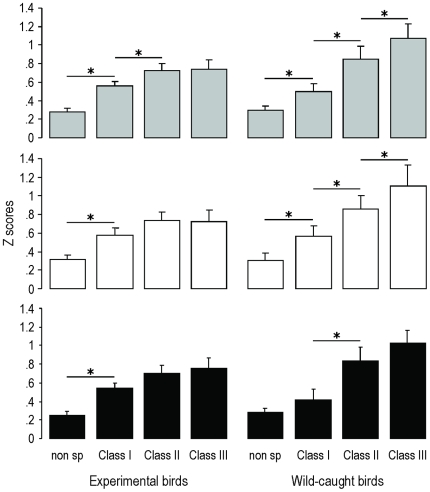
Figure 3. Experimental birds showed deficits not only in their vocalizations but also in their neural responses to sounds.
Mean (+SEM) Z scores obtained for each class of stimuli in experimental (n = 10) and wild-caught (n = 6) birds (data for the latter come from George et al. [38]) showed that, whereas all pairwise comparisons were significant for wild-caught birds, no difference could be observed between class-II and class-III songs for experimental birds. Grey bars: pooled data of both hemispheres; white bars: data of the left hemisphere; black bars: data of the right hemisphere. *: p<0.05 according to post-hoc tests.

