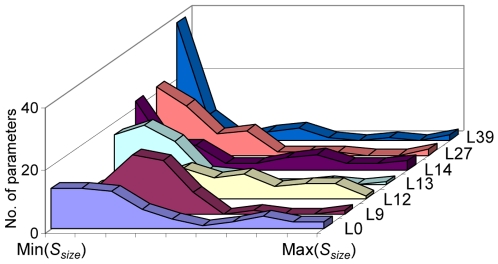
Figure 4. Distribution of sensitivity coefficients of parameters in two-loop Arabidopsis circadian clock model.
The histograms demonstrate the distribution of the sensitivity coefficient (Ssize) within each reference parameter set of the two-loop model. This shows the frequency distribution of parameters of the model displaying similar magnitudes of sensitivity.

